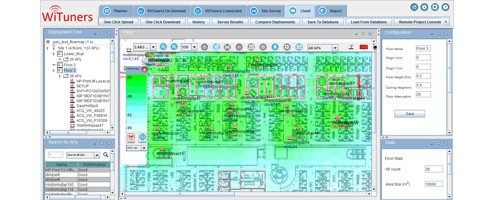
WiFi Signal Strength Heatmaps
Heat maps include RSSI, signal strength, data rates, throughput, QoS Score
A heatmap visually shows the distribution of a metric over locations within the deployment area on a floor plan. The metrics to be observed in the heat maps include RSSI ( the receiver signal strength indicator), the signal strength, the data rates, the throughput, the QoS Score etc, which can be selected from the drop-down list in the heat map indicator. The heat map indicator contains a drop down menu to allow the heatmaps to be viewed by different variables. The heat map indicator can be shown or hidden by checking the Heatmap button ![]() on the top tool-bar.
on the top tool-bar.
The metric observed can be a single selected AP, or all the APs on the floor. Note that the metric’s reading varies depending whether it is observed from the AP’s perspective or the client perspective. So you can select to view by AP or by client.
Note that any changes in the AP properties, client properties, their locations, properties of walls and their locations etc will be reflected immediately by the heatmaps.


Leave a Reply
Want to join the discussion?Feel free to contribute!