How WiTuners Help to Predict Wi-Fi Propagation Effects
Does your WLAN give you all of the features that were promised by the manufacturer? Did you get that high data rate that was printed on the box? Probably not. WiFi is such a complex system that the average buyer/deployer/user doesn’t stand a chance of understanding even the basics of what they need to know to keep a WLAN system running optimally.
See What’s Going On
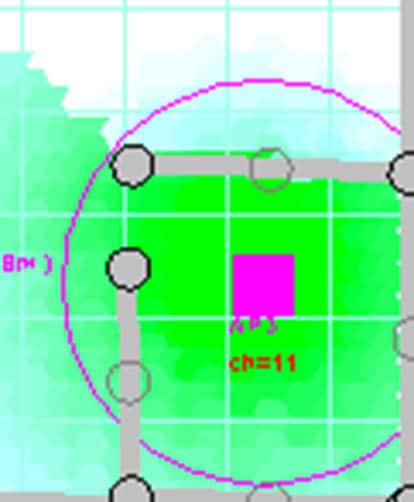
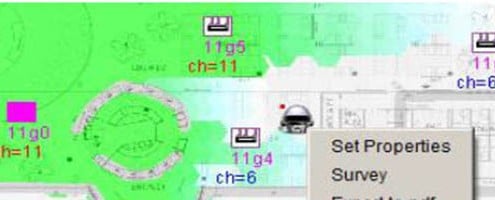
Modeling is the key, and you don’t have to be an RF engineer to diagnose your problems. There are many WLAN management tools out there and most provide a way to predict how the Wi-Fi energy radiates out of the antennas and is received in the environment by the users. The visualization is in the form of higher power (in one color), lower power (in another color), referred to as “heat maps”.  The one that we find most flexible and comprehensive is the deployment and optimization tool from WiTuners. And best of all, it’s free!
All you do is scan or draw an outline of your deployment area (walls, doors, etc.), place your APs, and assign characteristics.
Anybody can do this … really. The walls are placed by dragging and dropping onto the top of your imported drawing. You then right click on the wall and you can select from: drywall, wood, concrete, metal, or your own custom definition.
Next you place the APs around the building. Those too can be customized, or they can be left at their default configurations. All you really have to set is whether they’re 802.11b, g, n, or whatever the alphabet soup of the day is. WiTuners keeps current on the available wireless protocols and updates their software accordingly.
This tool is a SaaS (software as a service), so you run it in your browser. Just go to the WiTuners website and you start it up by clicking an icon. You get a heat map like the one shown. Now you’re ready to see how your WLAN works.


Leave a Reply
Want to join the discussion?Feel free to contribute!