WiTuners Planner in Wireless LAN Deployment
“So, what’s the big deal?” you tell your fellow school board members. “The principals and administrators think that they can’t get along without Wi-Fi any longer, we only have five school buildings plus the town offices, and I know how a network is put together. I’ll just run down to Best Buy, get some inexpensive APs (access points), string some wire in the drop ceilings, plug it all into our Ethernet, and we’ll be all set.”
This is how many a sad deployment saga begins, with a “Ready, Fire, Aim” approach to setting up a Wi-Fi network (wireless local area network or WILAN). But we all know how it unfolds: complaints about dead zones, data rates dropping in the cafeteria at noon, network anomalies, and high maintenance as mystery glitches plague the network.
Another more common circumstance might be that everyone just scratches their head and nobody can come up with a way to start at all. Maybe call the Geek Squad, but that doesn’t guarantee an optimal outcome either.
How does an end user client avoid these types of scenarios? Where can they go to help them plan, budget, and reduce their initial setup costs and continuing maintenance costs? Let’s start by putting a little structure into the deployment process.
WiFi Performance Check in WiTuners Planner
WiTuners generates heat-maps of the APs to exhibit the propagation characteristics within the WLAN environment. The AP radiation pattern is shown as a graduated color scale, and received values of power are listed at adjacent access points.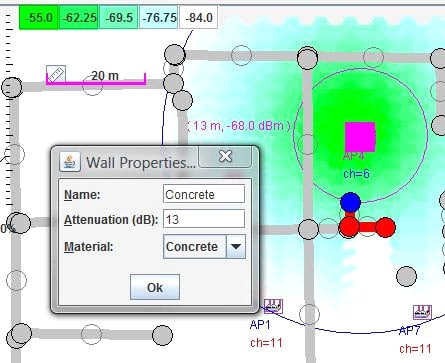
Fan shaped dead zones near columns, falloff through walls, and AP overlaps are easily identified. WiTuners provide a powerful means to visualize where one might expect areas of low connectivity or low throughput and then adjust the locations of APs accordingly.
The traffic load performance can be generated in order to predict the network performance. Simple statistical models are not adequate to model the system wide WLAN operational performance. One should use a time domain tool such as WiTuners so that a more realistic estimate is made, thereby minimizing the probability of running into upper bound problems, choke points, and dead zones. Such a tool not only indicates an upper bound of maximum capacity, but also provides an alert boundary that indicates that a network upgrade or operational change may be necessary.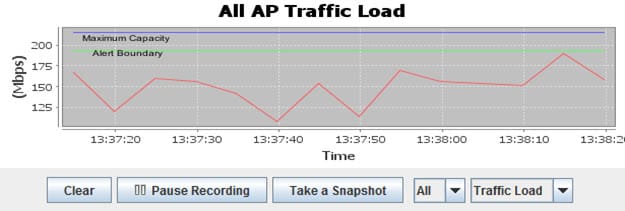
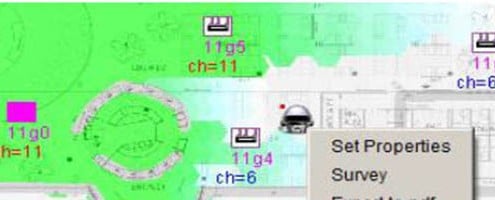
Particular locations of interest (cafeterias, conference rooms, etc.) can be problematic for a WLAN deployment, since client demands in such areas can be high (and usually accompanied by correspondingly high levels of complaints). For such areas, virtual site surveys should be performed on those areas, auto placement performed again, and a better deployment realized.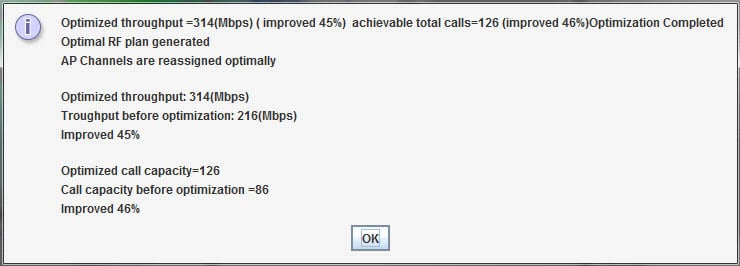
Once this level of planning has been achieved, a comprehensive report is generated, showing:
- Number of required access points
- Optimal locations and placements
- Optimal parameter settings
- Expected performance metrics
Such a report greatly simplifies the ordering process, the job of the installer, and the setup and operation by the network administrator.








Leave a Reply
Want to join the discussion?Feel free to contribute!