WLAN Auditing & Tuning Done Right with WiTuners
In Part One of this series, “WLAN Planning Done Right with WiTuners”, we looked at what’s involved in planning a WLAN and how WiTuners can help to easily generate a WLAN deployment plan. Now, how is your WLAN performing? How do you keep it operating optimally, adapting in a timely manner to the changes in your network conditions?
This isn’t an easy task. You can’t just look on the box the APs came in, read: It’s the newest 130 Mbps AP on the Market, multiply 130 Mbps by the number of APs that you have, and use that as the expected capacity of the network. Many factors will affect the throughput capacity of your network: interference, overlapping coverage, propagation anomalies, poor configuration selections, quality of service (QoS) policies, ad infinitum.
To make it even harder, the capacity must be determined in real time and accurately. The traffic changes (people move around, the mix of voice/video/data changes continuously), so the auditing service must run in near real time in order to accurately predict when the performance of the network is in jeopardy.
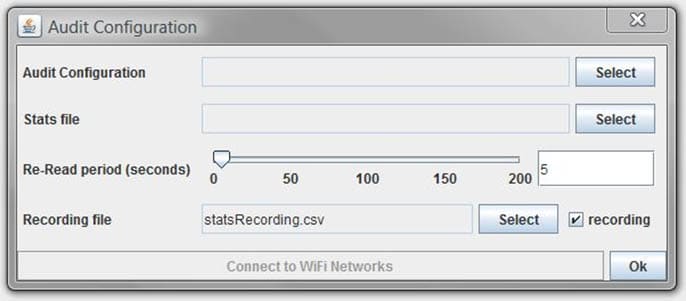
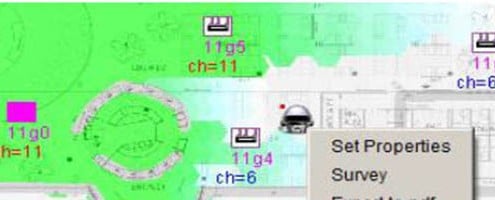
By using WiTuners Advanced Wi-Fi Tuning Technologies, real time estimation of performance can be achieved. First, the configuration of WiTuners captures the physical environment of the network. Second, the traffic mix of the real network is assimilated as a driver to the estimation process, and third, a real time profile of the network operation is captured.
The audit is started and time progresses. The WiTuners Audit accurately runs all of the environment and performance variables of the traffic, data, protocols, modem, propagation, and clients.WiTuners thereby “knows” how the network behaves and it generates the upper bound performance metric for auditing. Likewise, a level can be set slightly below this upper bound to serve as a warning that there is a high probability that things may start to go bad in the real world.
In the sample audit shown, the maximum network capacity is shown as a green line at the top of the real-time graph. The alert boundary in blue is slightly below the maximum. The network performs fairly well for about two-thirds of the time shown on the chart and then alerts are generated as the demand bumps into the alert line.


Leave a Reply
Want to join the discussion?Feel free to contribute!